How can different modes of documentation affect how we understand spaces?
I find having objects to interact with very engaging so I want my presentation to be tangible to a certain degree. Photos are good but I think having diagrams and graphs convey a clearer message as to what is being focused on/ deduced from the environment.
Tuesday:
Presenting 50+ documents
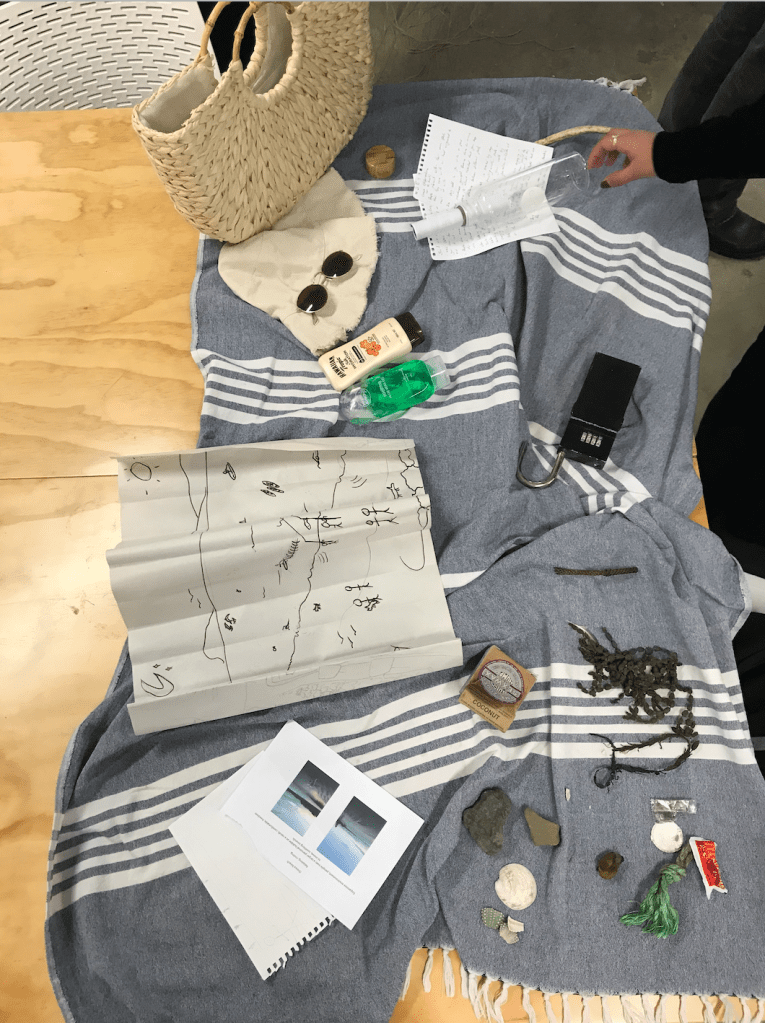
When presenting my documents I wanted to bring the beach to the studio. I brought all the essentials I usually take to the beach with me as documentation. This engaged the sense of smell as well as touch and sight.
Updated Document List 19/10/20:
- Intuitive Map
- General Beach Observations
- Surf wax box (scent)
- – 12. Photos
13. Surf rules
14. Party wave drawing
15. Shells (touch)
16. Rubbish
17. Seaweed
18. History of a Beach Day
19. Maoris relationship with the beach
20. Why the beach interviews
21. Sound Bites of Environment
22. Activities/feelings map
23. Council Rules for the beach
24. Foreshore Seabed act
25. Affect of the tide graph
26. 2nd iteration of Intuitive Map
27. Sand (touch)
28. Sea water (touch)
29. Interviews on how the beach makes you feel
30. Time of day observations
31. Site context map
32. Maori Context
33. Orewa Things to do panphlet
34. Erosion Research
35. Concentration of people Map
36. Personal Feelings toward the beach
37. Towel (touch)
38. Observations of peoples Actions
39. Observations of peoples actions
40. Drawings of environment
41. Diagram of movement paths
42. Model of placement of people
43. Artist research of art in orewa
44. Effects of the Weather observations
45. Graph of beach users age
46. Graph of activities engaged with in relation to age
47. Affect of time of day and activities
48. Diagram of the lay of the land
49. Local Attractions
50. Smells
51. Beach Attire worn vs time of day vs age
Feedback:
People really liked the way I displayed my documents.
Some things I could add were more models. drawings and diagrams, more documentation about how people act in the site, sound exploration and impact.
For my final hand in I will swap out some of the objects I have included in my presentation for more drawings, diagrams and notes as the balance was leaning more to collected objects rather than observational Studies that provide deeper understanding to the chosen environment.
Thursday:
Inventory:
– Make an Inventory using the prompts in this document. An additional note: Think about whether your inventory has to be a written list — maybe it should be a series of photos, a map of your house (with materials/methods located), a diagram, a flat-lay, a set of instructions, or a combination of these things! Be as inventive with the form of the Inventory as what you put into it.
